
The year 1995 was an exciting one. Michael Jordan came back from retirement, digital video disks (DVDs) were invented, Netscape went public after introducing the world to the internet via its web browser, and Coolio’s “Gangsta’s Paradise” was the song of the year. It was also an exciting year for investors.
After stumbling into the start of the year from drastic Federal Reserve (Fed) rate hikes in 1994, the S&P 500 quickly regained its footing and rallied consistently higher throughout 1995, amassing 77 record-highs along the way and setting a record for the largest number of new highs in a calendar year. For context, this equates to the market generating a new high every 3.3 trading days, leaving little room for downside volatility. During the year, the S&P 500 witnessed a maximum drawdown of only 2.5%, setting another record for the index.
Legendary technical analyst Ralph Acampora, who was running technical research at Prudential during the time, wrote a lengthy research note outlining his thesis for the Dow to reach 7,000 by early 1998, a bold call considering the index was trading only around 4,500 at the time. To the surprise of many, the Dow cleared the 8,000-point milestone by July 1997. And to the surprise of Ralph, the CEO of Prudential at the time gifted him a 1962 Corvette (part of Ralph’s thesis was predicated on market similarities from the 1962–1966 bull market). Another catalyst for his bullish forecast stemmed from the degree of skepticism following what many considered a stealth bear market in 1994.
Fast forward to 2024, and Michael Jordan is more likely to be playing golf than basketball, DVDs are collecting dust if they have not already been thrown out (I am still holding onto my Seinfeld collection), and Coolio has unfortunately passed away. And while many things have changed over the last 30-plus years, there are still some close market parallels between the 1994-1995 era and today.
Stocks are continuing to print record highs aboard a bull market built upon fear and skepticism. The S&P 500 has notched 17 new highs this year already. For context, this equates to a new high occurring roughly every three trading days. If this pace were to continue, the S&P 500 would have around 86 record highs in 2024, rivaling the record number of 77 registered in 1995. Perhaps equally as impressive as the market’s rate of change is the lack of downside volatility this year. The S&P 500 has only witnessed a maximum drawdown of 1.7% this year, which if this somehow holds (unlikely in our opinion), would break the record of the lowest drawdown of 2.5% set in 1995.
Similarities in price action between two periods is one thing, but similarities in economic conditions and the macro environment are another, and when they all align, our confidence builds for price action to at least rhyme. In 1994-1995, the Fed doubled interest rates to 6% to combat elevated inflation and cool the economy. The bond market suffered sizable losses and stocks stumbled into the tail end of the rate-hiking cycle. However, there was no recession as inflation stabilized and the economic expansion continued. As a result, the Fed cut rates in the summer of 1995, adding fuel to the bull market.
Sound familiar to you today? While 2024 may not top 1995’s record-setting 34.1% price gain, it does serve as an important history lesson that overbought conditions can persist for longer than most people expect, especially in strong bull markets. Inevitably, stocks will pull back, helping reset overbought conditions and bullish sentiment, provide fundamentals and opportunity to catch up with price, and open the door for another entry point into this bull market.
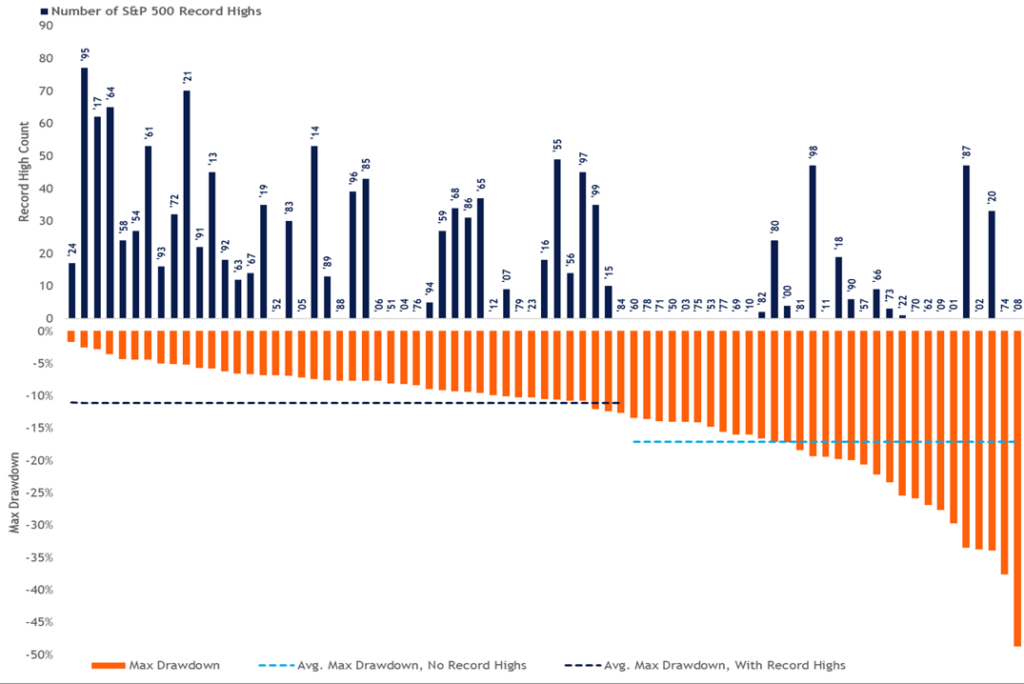
Turning back to history, what kind of pullback should investors expect? Years with record highs tend to have less downside volatility than years without. Since 1950, the maximum drawdown for the S&P 500 during years with a record high averaged -11.0%, compared to the average drawdown of -17.1% during years without a new high. Furthermore, annual S&P 500 price returns during years with a record high have averaged 13.7%, suggesting this year’s rally could have more room to run. This compares to average returns of only 3.0% during years without a record high.
S&P 500 Record Highs & Drawdowns by Year
Summary
The S&P 500 continues to print new highs as earnings and economic growth point more toward a soft-landing scenario than a recession. While inflation data remains more volatile than the market desires, investors appear complacent with the notion of rate cuts being on the horizon, and less concerned over the exact timing. The current backdrop also has many similarities to 1995, a year with limited downside volatility and unprecedented momentum, providing an applicable history lesson to today’s market that overbought conditions can persist for meaningful periods.
IMPORTANT DISCLOSURES
This material is for general information only and is not intended to provide specific advice or recommendations for any individual. There is no assurance that the views or strategies discussed are suitable for all investors. To determine which investment(s) may be appropriate for you, please consult your financial professional prior to investing.
Investing involves risks including possible loss of principal. No investment strategy or risk management technique can guarantee return or eliminate risk.
Indexes are unmanaged and cannot be invested into directly. Index performance is not indicative of the performance of any investment and does not reflect fees, expenses, or sales charges. All performance referenced is historical and is no guarantee of future results.
This material was prepared by LPL Financial, LLC. All information is believed to be from reliable sources; however LPL Financial makes no representation as to its completeness or accuracy.
Unless otherwise stated LPL Financial and the third party persons and firms mentioned are not affiliates of each other and make no representation with respect to each other. Any company names noted herein are for educational purposes only and not an indication of trading intent or a solicitation of their products or services.
Asset Class Disclosures –
International investing involves special risks such as currency fluctuation and political instability and may not be suitable for all investors. These risks are often heightened for investments in emerging markets.
Bonds are subject to market and interest rate risk if sold prior to maturity.
Municipal bonds are subject and market and interest rate risk and potentially capital gains tax if sold prior to maturity. Interest income may be subject to the alternative minimum tax. Municipal bonds are federally tax-free but other state and local taxes may apply.
Preferred stock dividends are paid at the discretion of the issuing company. Preferred stocks are subject to interest rate and credit risk. They may be subject to a call features.
Alternative investments may not be suitable for all investors and involve special risks such as leveraging the investment, potential adverse market forces, regulatory changes and potentially illiquidity. The strategies employed in the management of alternative investments may accelerate the velocity of potential losses.
Mortgage backed securities are subject to credit, default, prepayment, extension, market and interest rate risk.
High yield/junk bonds (grade BB or below) are below investment grade securities, and are subject to higher interest rate, credit, and liquidity risks than those graded BBB and above. They generally should be part of a diversified portfolio for sophisticated investors.
Precious metal investing involves greater fluctuation and potential for losses.
The fast price swings of commodities will result in significant volatility in an investor’s holdings.
Securities and advisory services offered through LPL Financial, a registered investment advisor and broker-dealer. Member FINRA/SIPC.
Not Insured by FDIC/NCUA or Any Other Government Agency | Not Bank/Credit Union Deposits or Obligations | Not Bank/Credit Union Guaranteed | May Lose Value
For Public Use – Tracking: #554253